What Are Heatmaps, and How Can I Use Them in my Marketing?
Heatmaps are a way to visualise complex data about how users interact with web pages. Heatmap services collect and interpret data from activity such as clicking, scrolling and time spent on different parts of the page, and then translate that into an overlay which shows you what parts of your page users interact with most and which they ignore. In other words, which are “hot” and which are “cold”.
Here’s an example of a heat map from Hotjar.com:
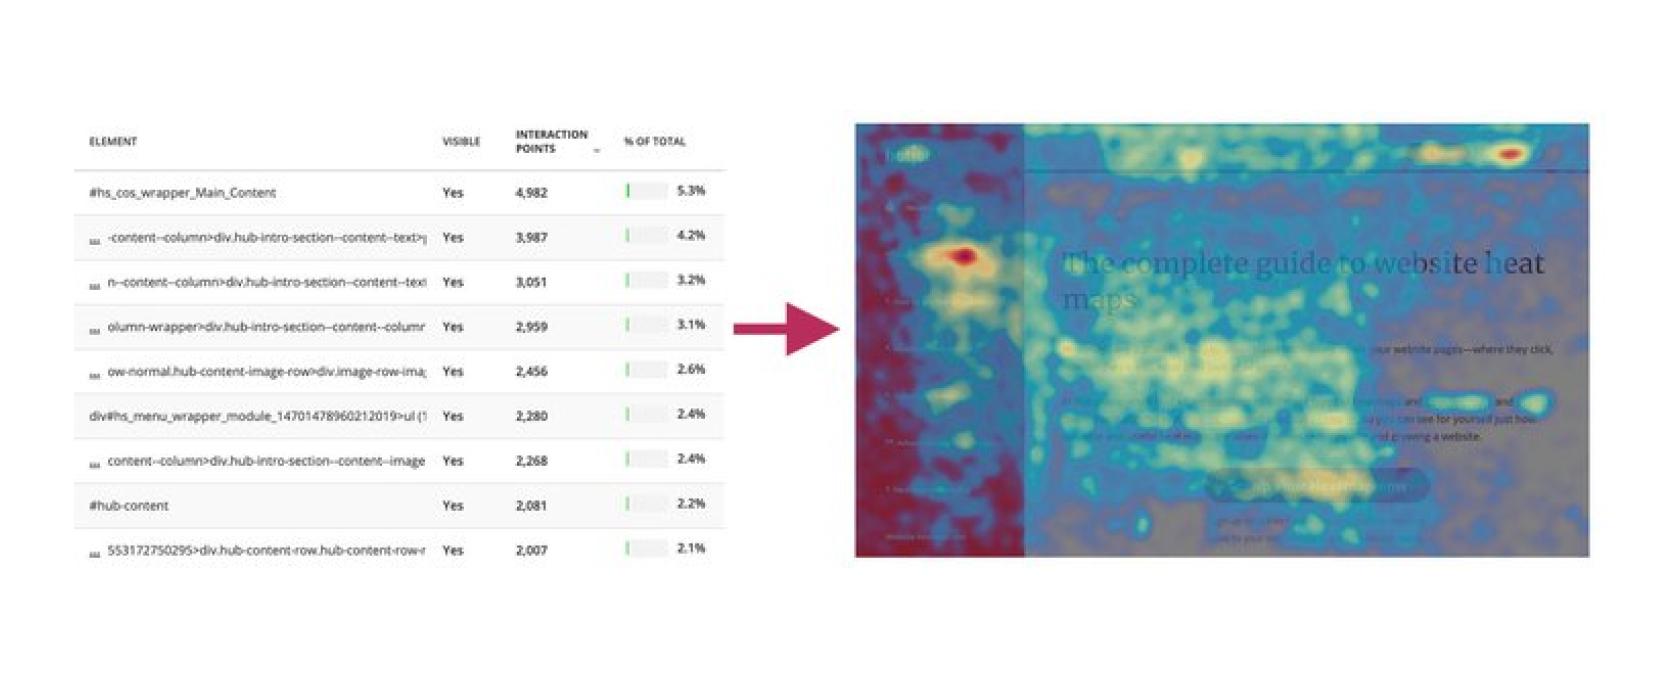
Here, you can see how the data in the left hand table is translated into an easily understandable overlay on the right. The two most interacted with links, represented in the red spots on the left and top right, are bright red. The rest of the page is yellow and green, showing that the next most interacted with area is the main text of the article.
How do heatmaps work?
You can’t see a heatmap for just any old website: it has to have heatmapping tool installed. This lets the software start tracking the clicks and other activity it needs to gather the data.
Most heatmapping tools for websites analyse mouse data. This includes:
- Clicking
- Scrolling
- Exit intent (e.g. moving the mouse towards the back button)
- Moving across text (to track reading place)
The behavioral science behind this idea is that we move our mouse roughly in tandem with our eyes. Wherever we’re looking, our mouse usually follows. Therefore, heatmapping can be a reliable way of tracking not only where users interact, but also what they’re paying attention to.
But, advanced heatmapping tools are also now available for the big players which actually use a laptop’s camera to track eye movement. This means approximating behavior based off mouse activity is no longer needed – we can actually see where people are looking on the web page.
Due to the ethics of watching people through their laptop cameras and the relative newness of the technology, this isn’t a viable choice for most people. But it is an example of how powerful heatmapping can be.
How do I use heatmaps in marketing?
Heatmapping tools give a twenty-thousand word marketing report in one easy to understand image. You literally have a roadmap to optimising your marketing campaigns because when you can see what your audience is interacting with and what they are ignoring, you can interpret that data into optimisation.
Take a look at the following image of an A/B test from Creatopy.com:
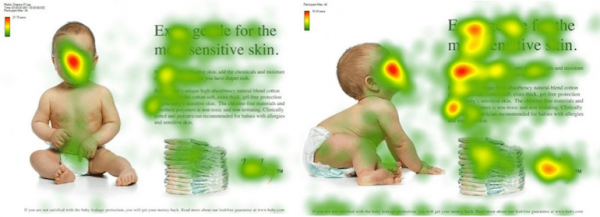
The image on the left is the original landing page. On the face of it, they seem to have followed all the marketing rules: have a human face, nice bold text, good copy, and a call to action. But as you can see, while nearly everyone looked at the baby, nobody went to click on the CTA.
What the marketers did to optimise this landing page was change the image – they kept the baby, but chose an image where it seemed to be looking at the text. And as you can see, it worked wonders.
The marketers noticed an opportunity to take advantage of another fact of behavioral science: that of Fitt’s Law, which, in simple terms, states that “people look where others are pointing”. No matter if an object is pointed to with the eyes, by touching the object, directing with the finger, an arrow or with the gaze of others – is an innate behavior of humans that works perfectly in advertising.
In other words, what is that baby looking at? Why is it so interesting? We must look, too!
You can see that the next red “heat” points after the baby’s face are the portions of text it’s directly looking at, and after that, the CTA text. It’s worth noting here that the marketers changed nothing about the copy or the other images: only where the baby was looking.
How to use heatmaps yourself
There are now quite a few heatmapping services available, such as those from Hotjar and Crazy Egg, which will help you monitor each visitor’s interactions with your site and find areas for improvement.
But even if you have the most detailed heatmaps on the planet, all of your marketing sweat is down the drain if you don’t know how to implement that information in the best way possible.
That’s why you should ask yourself the following questions when you get your heatmap:
- Where are visitors ignoring?
- Is my most important content being seen?
- Are people clicking key buttons? (CTA’s, form submits, etc)
- Are people confused by non-clickable elements?
- Are people getting distracted? If so, where?
Heatmaps are an incredibly powerful source of marketing data, if you have enough traffic to make them meaningful. They might just reveal a new strategy hiding in plain sight, or pay dividends in the form of page optimisation.
Have you used heatmaps in your online marketing? How did they work out for you? Let us know in the comments!