Best KPI Software and Key Metrics Every Website Should Track
Key Performance Indicators – everyone loves to talk about them, but not everyone knows how to use them effectively. The right key metrics can show you exactly how your website and business are performing, while the wrong ones can leave you guessing.
This is where KPI software comes in. These tools help businesses track KPIs across websites, marketing campaigns, sales, and operations. By bringing all your data into one place, KPI software makes it easier to visualize progress through dashboards, automate reporting, and access real-time, actionable insights.
Here are our top KPI software picks:
- Convertri
- ClickUp
- Databox
- Microsoft Power BI
- Tableau
So, read on to discover how to choose your own key performance indicators, and which software might be worth trying.
Key Takeaways:
- The right KPIs + the right KPI software = clear, actionable insights that show exactly how your website and business are performing.
- Top KPI tools like Convertri, Power BI, Tableau, Databox, and ClickUp help you track key metrics, automate reporting, and visualize performance in real time.
- Choosing KPIs starts with your business goals, measuring what actually moves the needle, avoiding vanity metrics, and using dashboards to make data-driven decisions faster.
Discover how your website is performing in real-time. Get a free trial and start tracking your KPIs instantly.
What are Key Performance Indicators (KPIs)?

Plainly speaking, KPI is the unit of measurement you need to use to find out how awesome your website is. You define the KPI’s, and whether you’re hitting them or not tells you how well your business is doing. If we’re talking speed analogies, your KPIs are your KMHs – they tell you if your website is performing like a Ferrari, or a ’96 Nissan Micra.
Being user-defined, what KPIs you use are up to you. But there’s no point in basing your success on email subscribers if you don’t have a newsletter, or marketing spend if nothing comes of it.
Best KPI software tools
Below are the five best KPI software tools, including beginner-friendly dashboard tools, enterprise data analytics platforms, and niche solutions for performance-focused marketing funnels.
1) Convertri
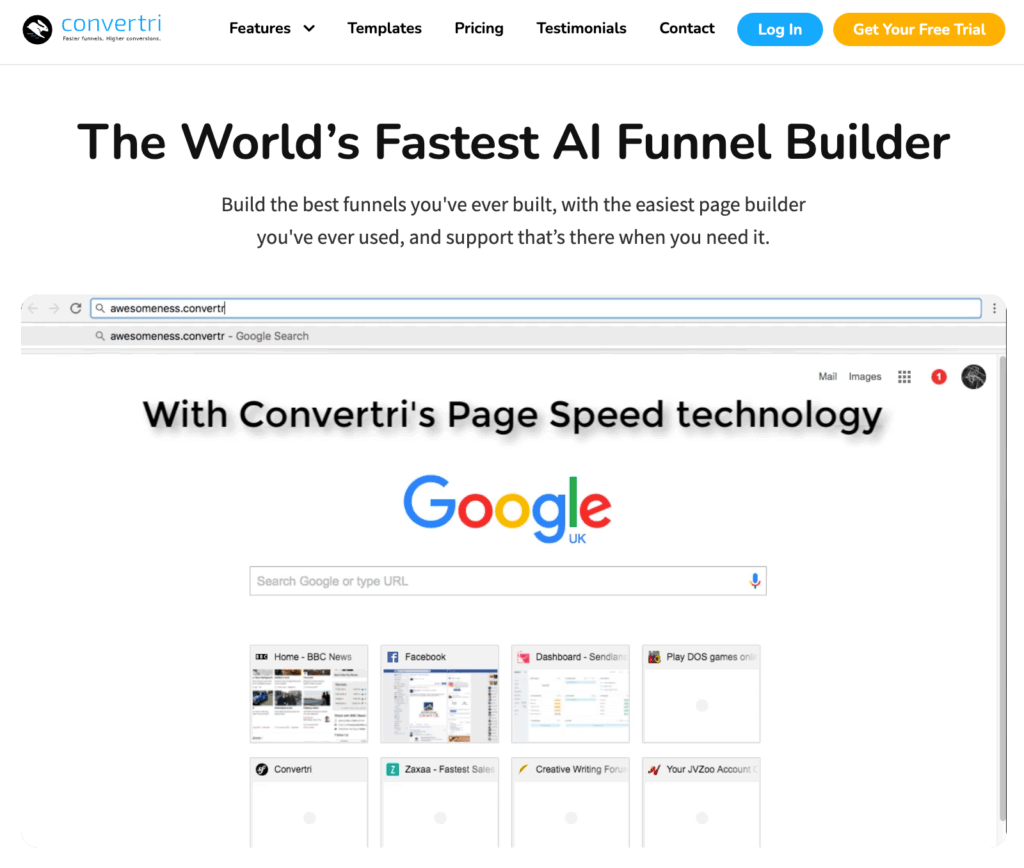
Convertri is a KPI-driven funnel builder with integrated performance dashboards. Although Convertri’s KPI capabilities are focused on funnel and page conversion performance, not provide full KPI tracking across datasets.
Best for: Marketers, funnel builders, small businesses focused on conversions
Key features:
- Integrated funnel tracking
- Ultra-fast page loading
- A/B testing insights
Pros: Fast, conversion-focused, simple to use
Cons: Limited as a general BI tool
Pricing:
- 14-day free trial available
- Convert plan at $99/mo
- Scale plan at $199/mo
- Maximize plan at $299/mo
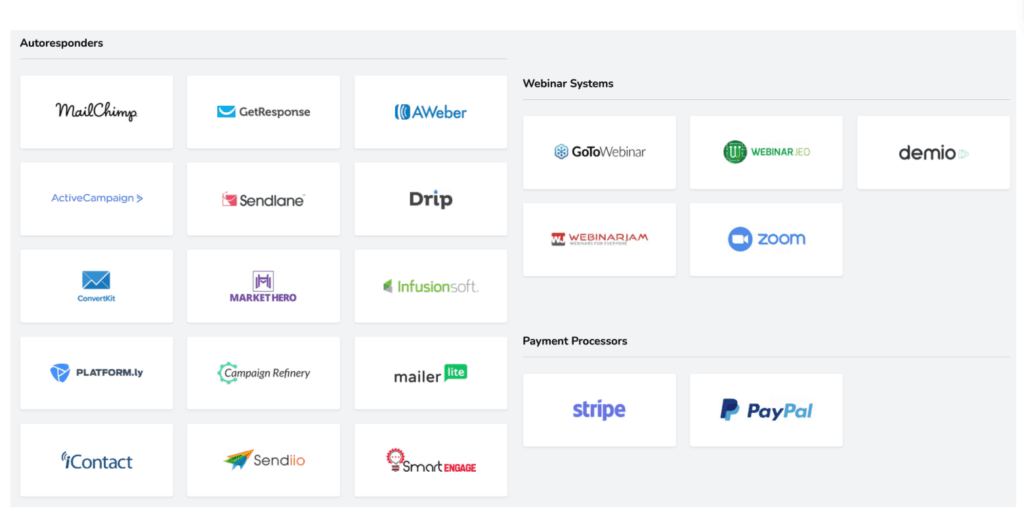
Integrations: Autoresponders, webinar systems, payment processors
2) ClickUp
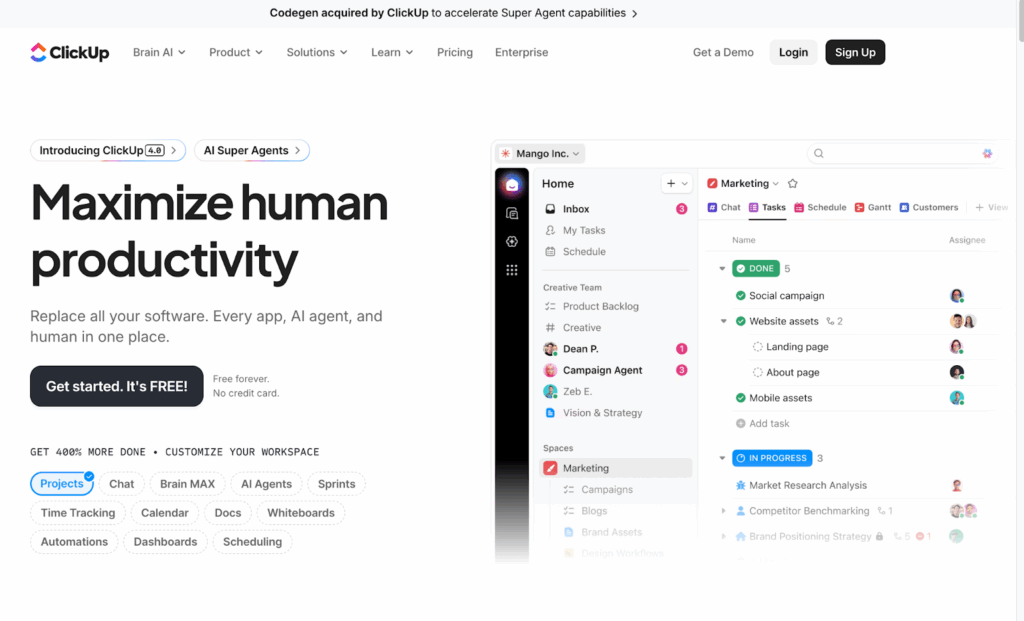
Project management with KPI tracking.
Best for: Teams that want KPIs directly inside their workflows
Key features:
- Custom dashboards
- Task and goal tracking
- Cross-team reporting
Pros: Combines KPIs with productivity tools
Cons: Can feel overwhelming for simple analytics needs
Pricing:
- Free Plan
- Unlimited plan at $7/user/month
- Business plan at $12/user/month
- Enterprise (custom pricing)
Integrations: Slack, Google Workspace, HubSpot, GitHub
3) Databox
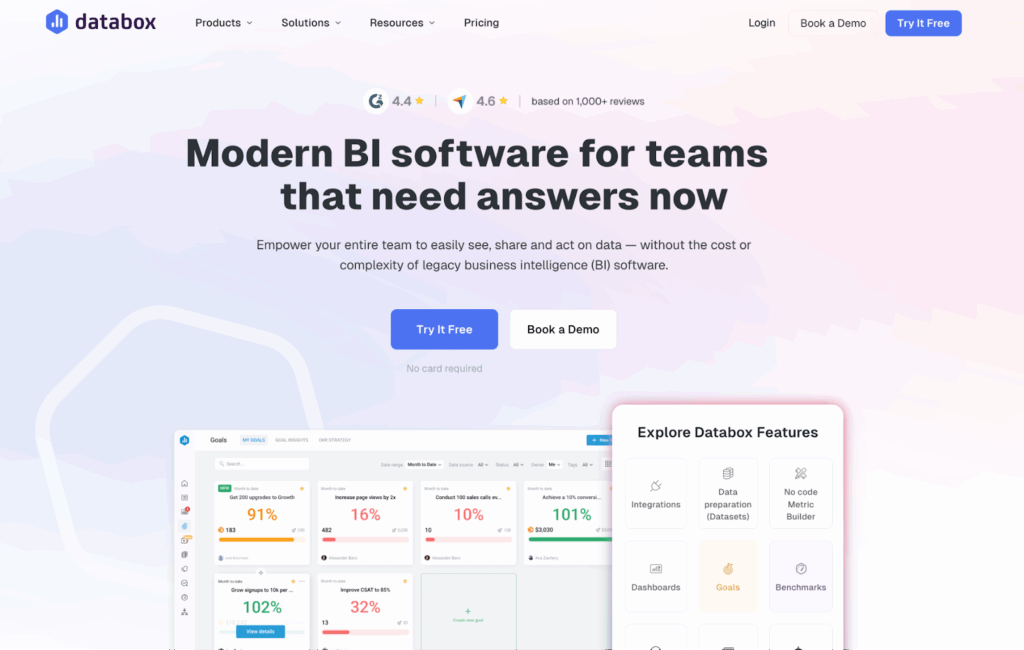
A dashboard tool with plug-and-play connectors
Best for: Agencies, marketers, SMBs
Key features:
- 70+ one-click integrations
- Goal-tracking and alerts
- Mobile dashboards
Pros: Easy setup; great templates
Cons: Limited customization in lower plans; Pricing scales quickly if you need many “Data Connections.”
Pricing:
- 14-day free trial available
- Professional plan at $199/month
- Growth plan at $499/month
- Premium plan at $999/month
Integrations: GA4, HubSpot, Shopify, Facebook Ads, Google Ads
4) Microsoft Power BI
It’s a software with analytics and data modeling.
Best for: Data-heavy organizations already using the Microsoft ecosystem.
Key features:
- Custom dashboards
- Real-time data refresh
- AI-powered insights
Pros: Robust; excellent for complex datasets
Cons: Steep learning curve. It can be overkill for a simple blog or small site.
Pricing:
- Free Account
- Power BI Pro at $14/mo
- Premium Per User at $24/mo
- Microsoft Fabric (Variable)
Integrations: Excel, Azure, SQL Server, and 100+ cloud sources.
5) Tableau
Visual analytics for data-heavy organizations
Best for: Visual storytellers and complex data analysis.
Key features:
- Drag-and-drop dashboard building
- Predictive analytics tools
- Advanced visualization types
Pros: Interactive dashboards and deep customization
Cons: Expensive for small teams
Pricing:
- Standard plan at $75/mo
- Enterprise plan at $115/mo
- Tableau+ Bundle plan (Contact Sales)
Integrations: Salesforce, Google Analytics, databases, cloud storage
Choose Power BI if you have millions of rows of data. Choose Convertri if you want to pay less for ads, keep more of your visitors, and see your sales KPIs go up through a streamlined KPI dashboard experience that helps you quickly interpret performance data.
Measure what really matters to your business. Get started and gain clarity on your top-performing metrics.
How to choose your KPIs
Every business is different. That’s why your KPIs may be different than someone else’s, even in the same industry. For example, say you’re an artist selling original paintings. A common KPI is profit or revenue. But as a new artist, you have different priorities than an established name. If you have a day job and just need to get your name out there, social media mentions might be more valuable to you right now than profit.
To start recognising your KPIs, you need to be clear about your business goals. Who are you? Where do you want to go? What are you trying to accomplish?
They should help you establish a clear connection between your online efforts and your goals. Then, you can use them to make some data-driven decisions that will yield results.
Key performance indicators are not:
- Vague
- “Nice-to-knows” (just because the numbers are interesting, doesn’t make them valuable)
- Vanity metrics (just because you have more hits than the other guy, it doesn’t make it good for your business)
Key performance indicators are:
- Quantifiable
- Actionable
- Clear
- Tied to your business goals
In other words, you need numbers that have proven strategies for improvement, nothing that is out of your control. And they need to matter to you, your business, and where you want to be in the next five years.
Take a look at this table from Crazy Egg:
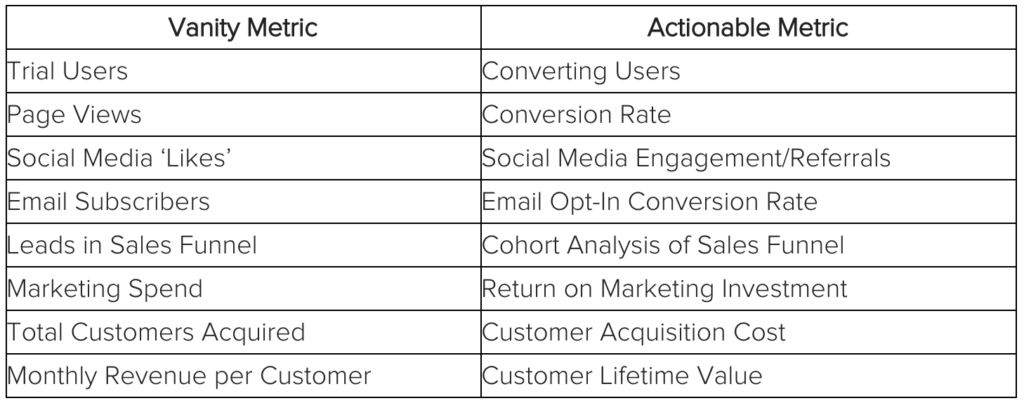
All the numbers in the Vanity Metric column might give you the warm fuzzies, but ultimately, their equivalents in the Actionable column will get you more results.
Best KPIs for an ecommerce site
When we’re talking ecommerce, we’re talking sales. Revenue. Cost per unit. This kind of website has very specific and measurable KPIs which won’t apply to any other industry, but which can be applied to whatever niche you’re in.
Checkout conversion rate
This is the number of visitors that complete an order. This is a high-level metric, so it’s best used in tandem with others to nail down where you can make improvements.
Cart abandonment rate
Any ecommerce website that is already generating sales will often benefit most from measuring and improving its cart abandonment rate.
This metric represents site visitors that were close to completing a purchase — and then vanished. Instead of focusing on throwing more traffic at your site, focusing on how many potential customers bail out at the last moment and what you can do to make them stay will ultimately be more worthwhile.
Referral source
Where are your customers coming from? If you’re only getting a tiny minority from your Facebook ads but a whole bunch from Instagram, you know to spend more money on that platform instead. Similarly, if your affiliates are doing really well but organic search is down, it might be worth seeing how you can boost organic discover rates.
Best KPIs for a blog
Blogs are different in that eyeballs matter more than sales. But which are the best methods for tracking readers’ attention? As we discussed, “awareness that my blog exists” is a super vague metric that can’t be measured and won’t really help even if you could quantify it.
So let’s break it down – what do you need to measure instead?
Email subscribers
If you write a blog, you should have a list, even if “all” you do is notify subscribers when a new article is up. Having subscribers means that those people care enough about what you write to give you their personal information in order to read more, or be notified when you put up new content. Now, that’s valuable.
Average pages per session
This depends on how your website is set up. Ideally, you’ll have each post on its own page, so you’ll be able to specifically measure how many posts and pages each user visits every time they go on your site. Are they only scanning the headlines on the front page? Maybe clicking the newest article? Or are they reading multiple posts back to back? Knowing how your users behave on your site can give you insight into what content they like most, and how you can give them more of it.
Traffic source
Like the ecommerce example, it’s important to know where your traffic is coming from in order to improve it. This can give you insight into whether you need a better backlinking strategy, what keywords you need to use more of to show up in organic search results, and more.
Best KPIs for lead generation
Sometimes, you just need leads. A simple opt-in page that leads to a thank you may be all the website you need for your business, but there are still some KPIs you need to pay attention to.
Conversion rate
Of course, this one matters the most. How many people are actually submitting their information on your form, and how can you get more of them to hand over their info? This is the single goal of a lead generation website, so it makes sense to measure this first.
Form abandonment rate
On the other hand, how many people fill out half of their first name and disappear completely? This may be for a number of reasons – maybe your form is too long, or they don’t trust you. Maybe they realise they don’t need your service. Once you know how many people are wandering away, it’ll be easier to find out the cause.
Traffic source
If you hand out business cards, your traffic source is going to look like people typed in your URL out of thin air – but maybe it’s worth ordering more, or fewer. You might also get some decent traffic from organic search, so how can you include more relevant keywords? Knowing how traffic is arriving on your site is one of the best KPIs for lead generation, as it’s easily actionable for a big impact later on.
Boost conversions by tracking the right KPIs. Start your free trial and watch your metrics guide smarter decisions.
How to choose KPI software
When comparing KPI tools, focus on the features that matter most to performance tracking and business intelligence. Many businesses also look for KPI dashboard software that allows them to create dashboards easily without heavy technical skills.
1) Integrations
Does it connect natively to your stack? Strong data integration ensures your KPI data stays accurate and automatically synced across tools.
Look for platforms that connect with:
- CRM tools (HubSpot, Salesforce)
- GA4 and Google Ads
- Ecommerce platforms (Shopify, WooCommerce)
- Ad platforms (Meta, TikTok, LinkedIn)
Using third-party connectors can add hidden costs and lag.
2) Real-time reporting
Do you need up-to-the-minute data (like for a flash sale), or is a daily sync enough? This is essential for fast decisions, especially in ecommerce or paid ads.
3) Automation & alerts
Can the software ping you via Slack or Email if a metric drops below a certain threshold? Automated goal tracking, scheduled reports, and real-time alerts save hours.
4) Dashboard templates
Don’t reinvent the wheel. Look for software that offers “Ecommerce” or “SaaS” templates out of the box. Prebuilt templates also help you get reporting up and running instantly.
5) Data connectors
Ensure your tool can pull data from all the sources you rely on without requiring manual CSV uploads. A tool is only as powerful as its reach; if it can’t talk to your CRM, payment processors, or ad platforms, you’ll end up with “data silos.”
Look for native integrations that offer a “set it and forget it” connection, ensuring your dashboards stay updated automatically as your business grows.
6) Role-based access
Can you control who sees sensitive financial data vs. marketing stats? For instance, your sales team needs to see lead volume and close rates, while your marketing team needs to see ROAS (Return on Ad Spend).
Keeping sensitive profit margins or payroll data restricted to executives prevents information overload and protects company privacy.
7) Pricing tiers
Before committing, look past the initial price. Most platforms offer different tiers based on your specific needs, so consider:
- Free Plans: Great for solo bloggers or testing the interface.
- Per-User Pricing: This can get expensive quickly as your team expands.
- Technical Limitations: Check for caps on the number of dashboards you can build, the number of “data points” you can track, or the frequency of data refreshes.
- The “Connector Tax”: Some tools charge extra for premium integrations, so factor that into your total cost of ownership.
Are you looking for a KPI-driven funnel performance tool? Convertri helps you track conversions and engagement across campaigns. Its intuitive dashboards show which funnels are working best and where you can improve.
Final thoughts
KPIs don’t have to be scary. In fact, selecting good website KPIs is an essential part of monitoring and evaluating your site’s success – and that’s never a bad thing. KPI’s let you accomplish your goals more easily and determine what success looks like. With the right tools, especially those that help you visualize performance metrics, your entire KPI workflow becomes simpler and more effective.
Which KPIs do you measure, and why? Let us know in the comments!